CHPW Web Data Visualization Dashboards
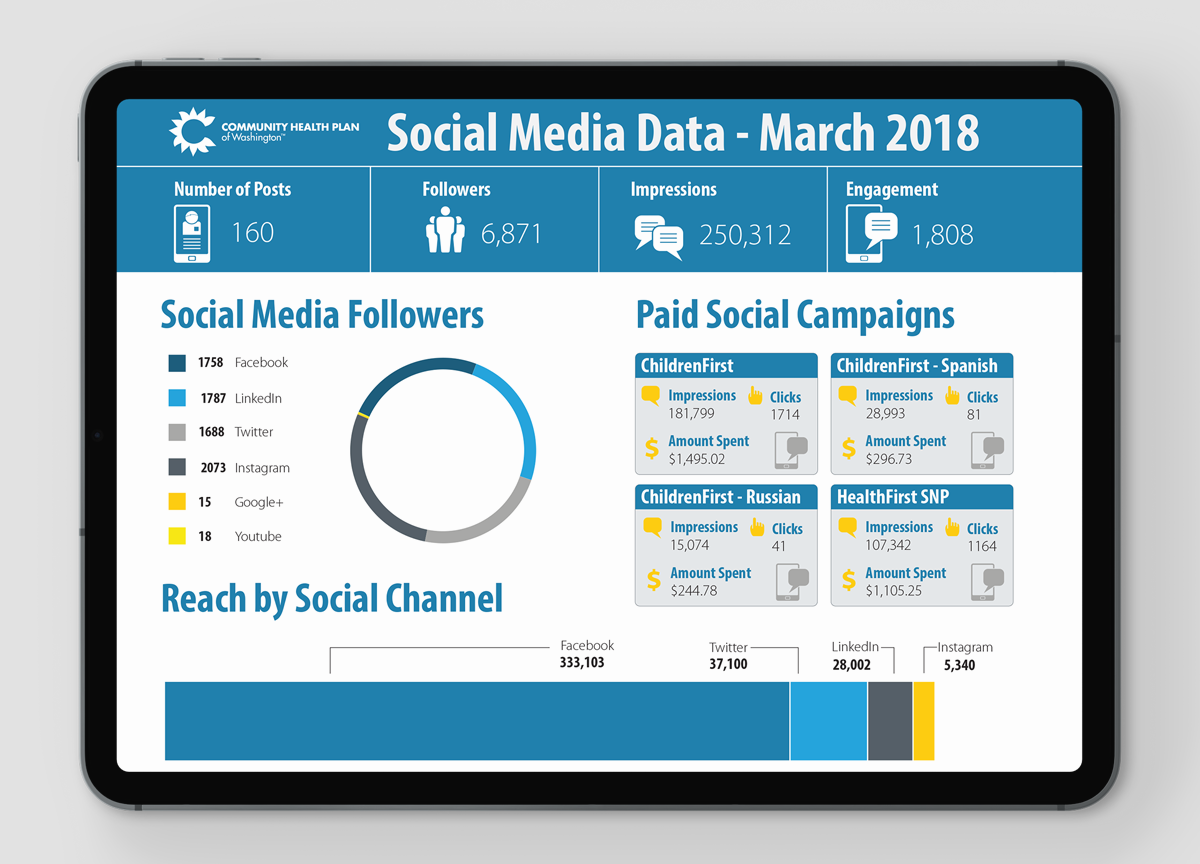
Monthly Social Media Data
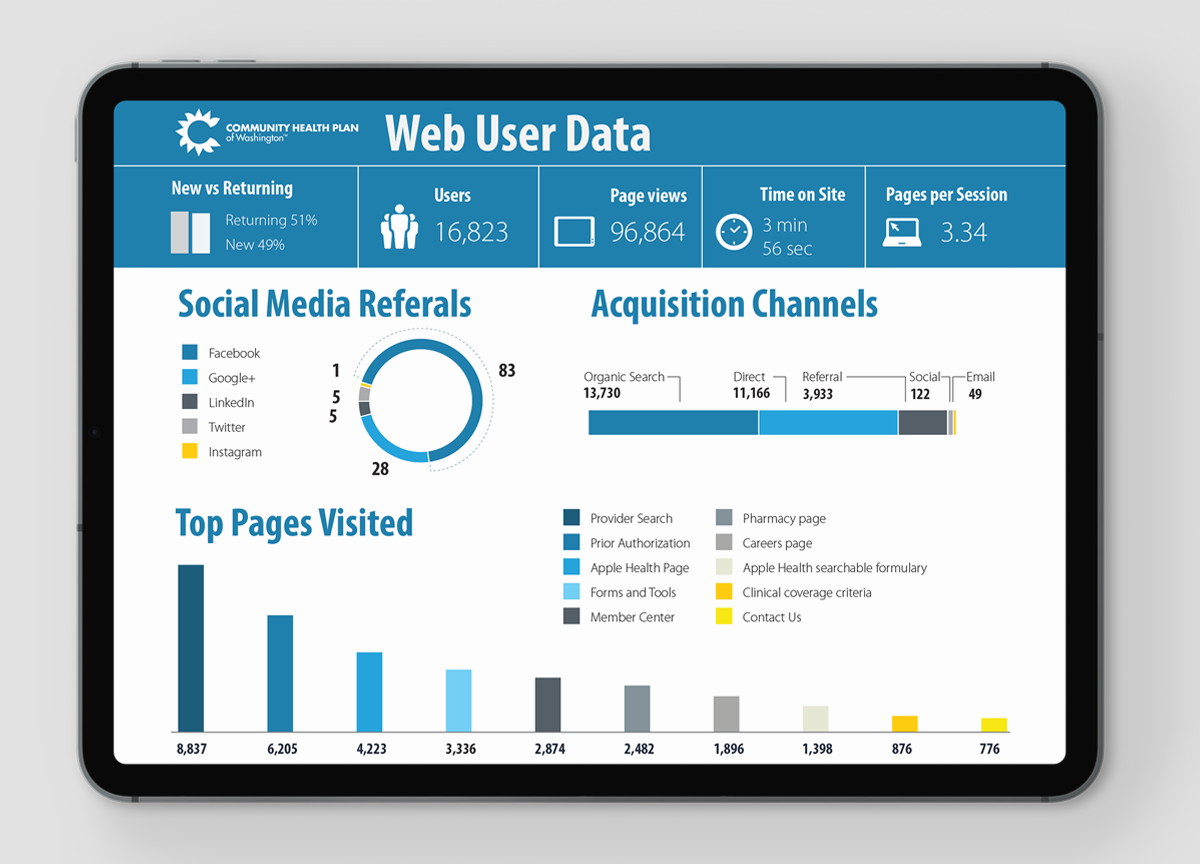
MONTHLY Website DATA
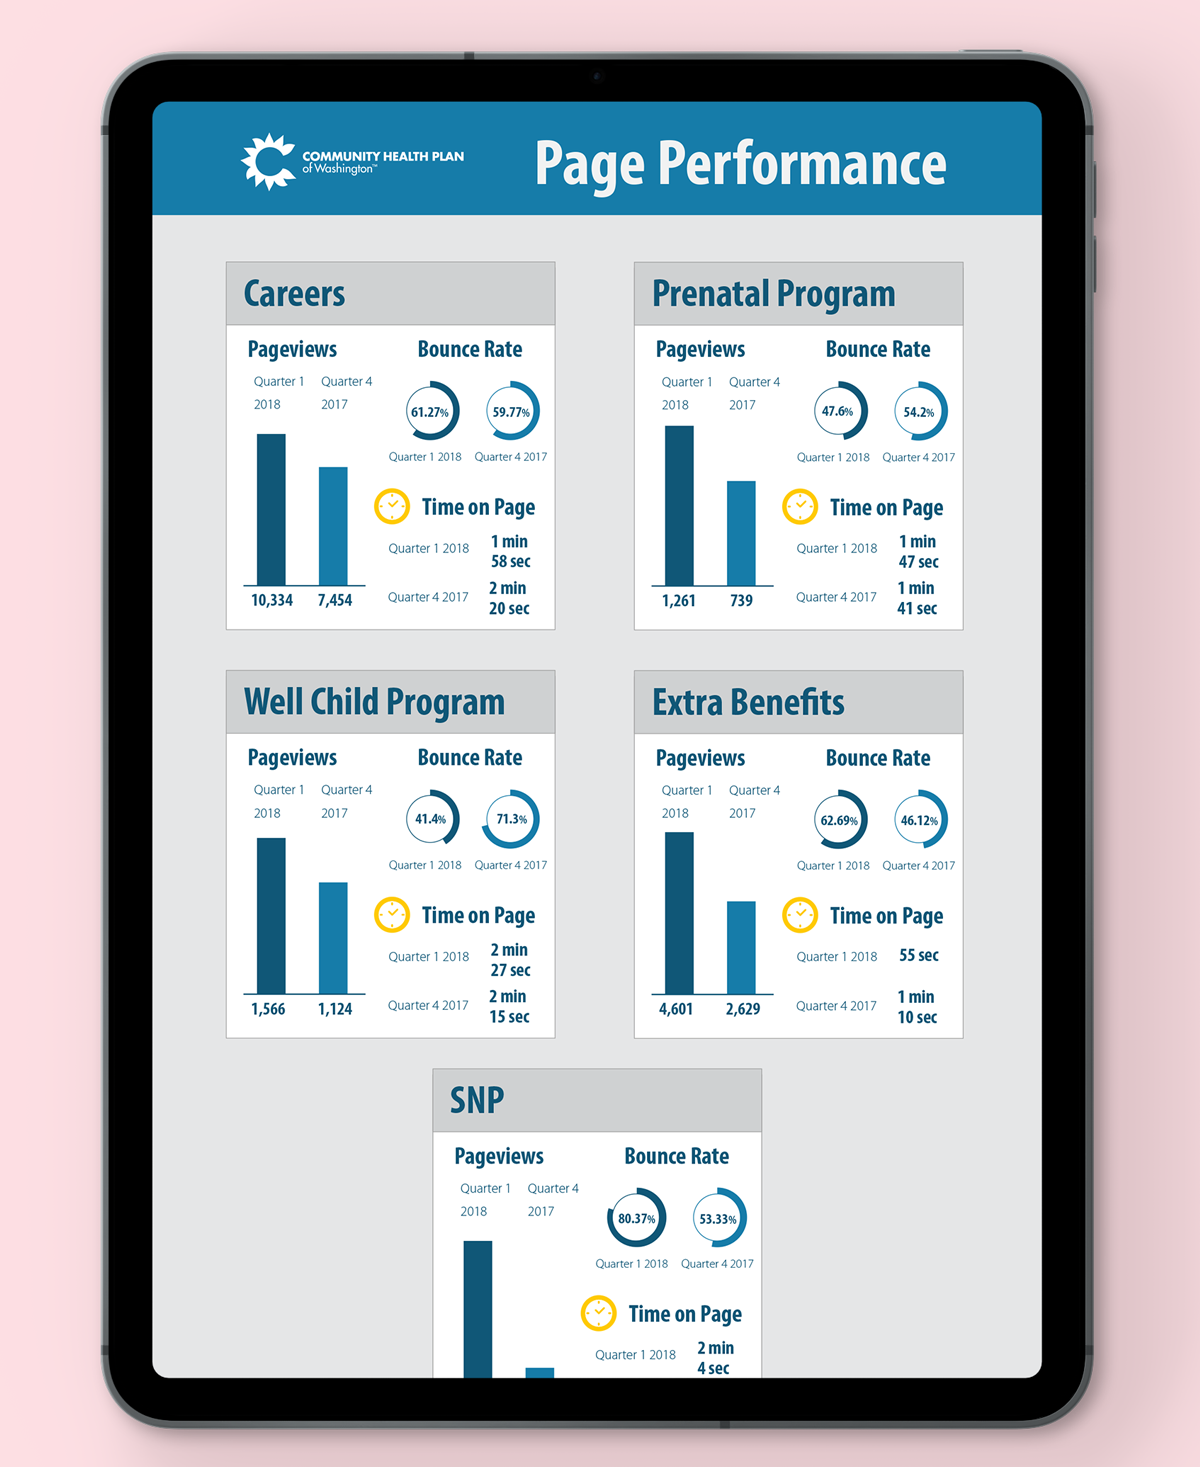
Quarterly Page Performance
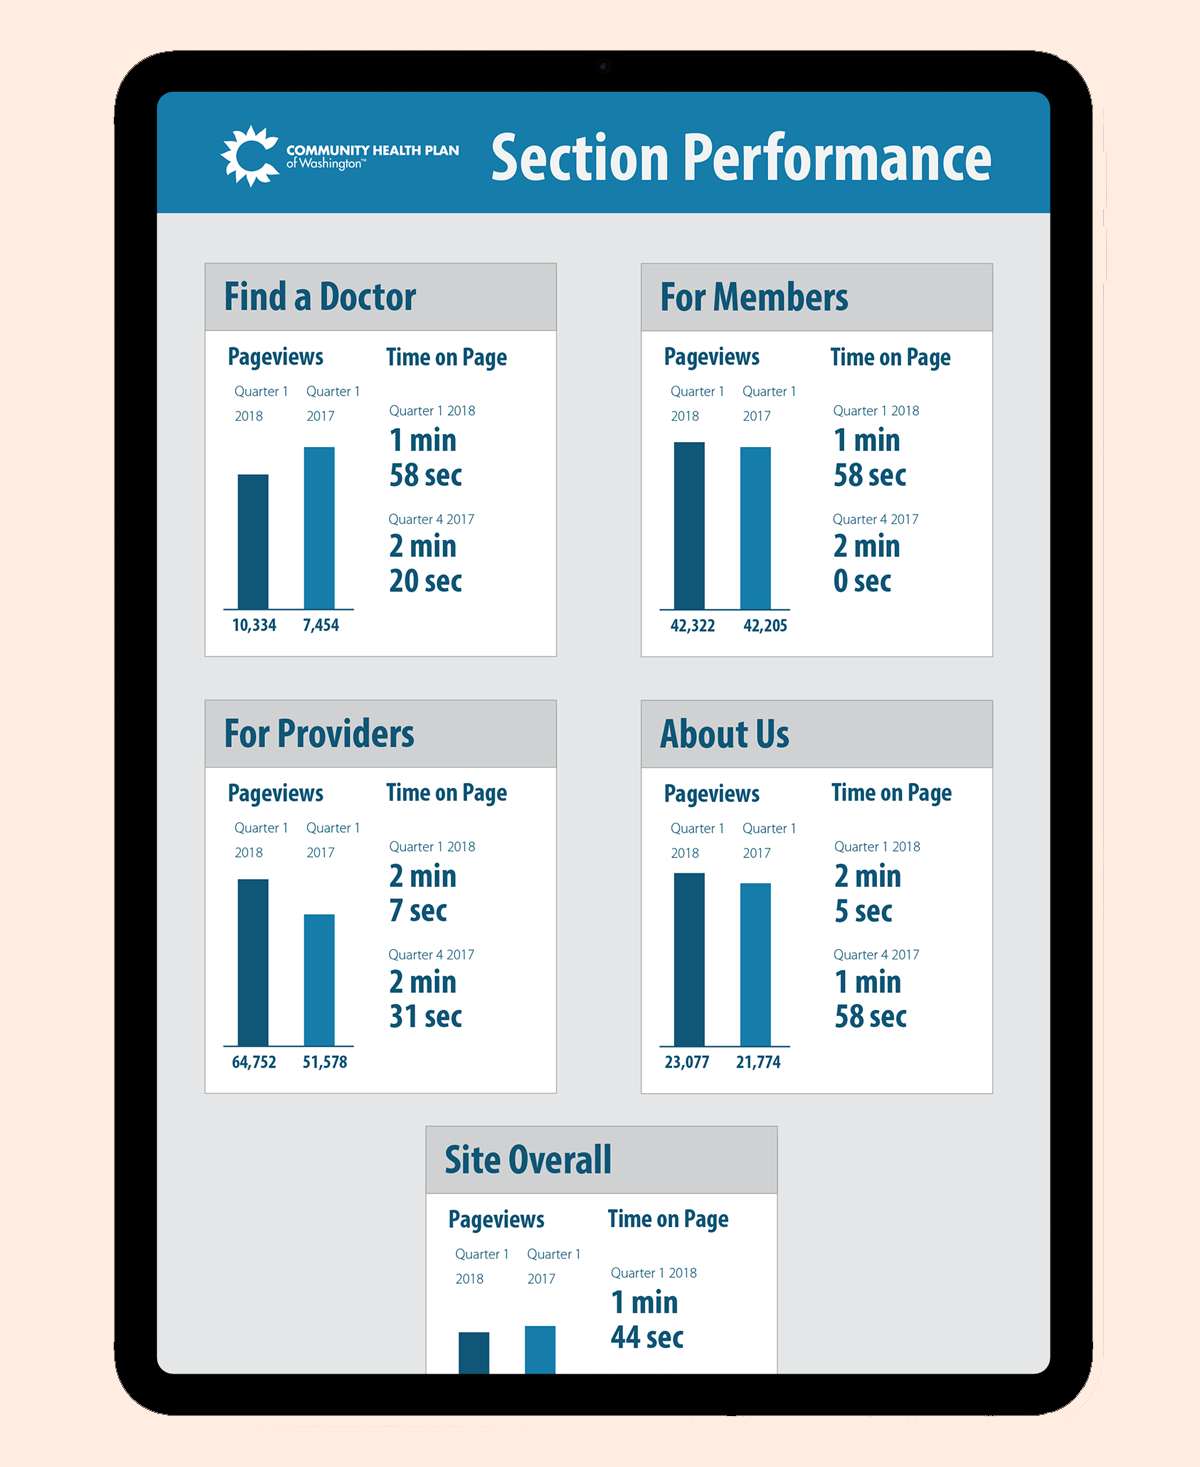
QUARTERLY SECTION PERFORMANCE
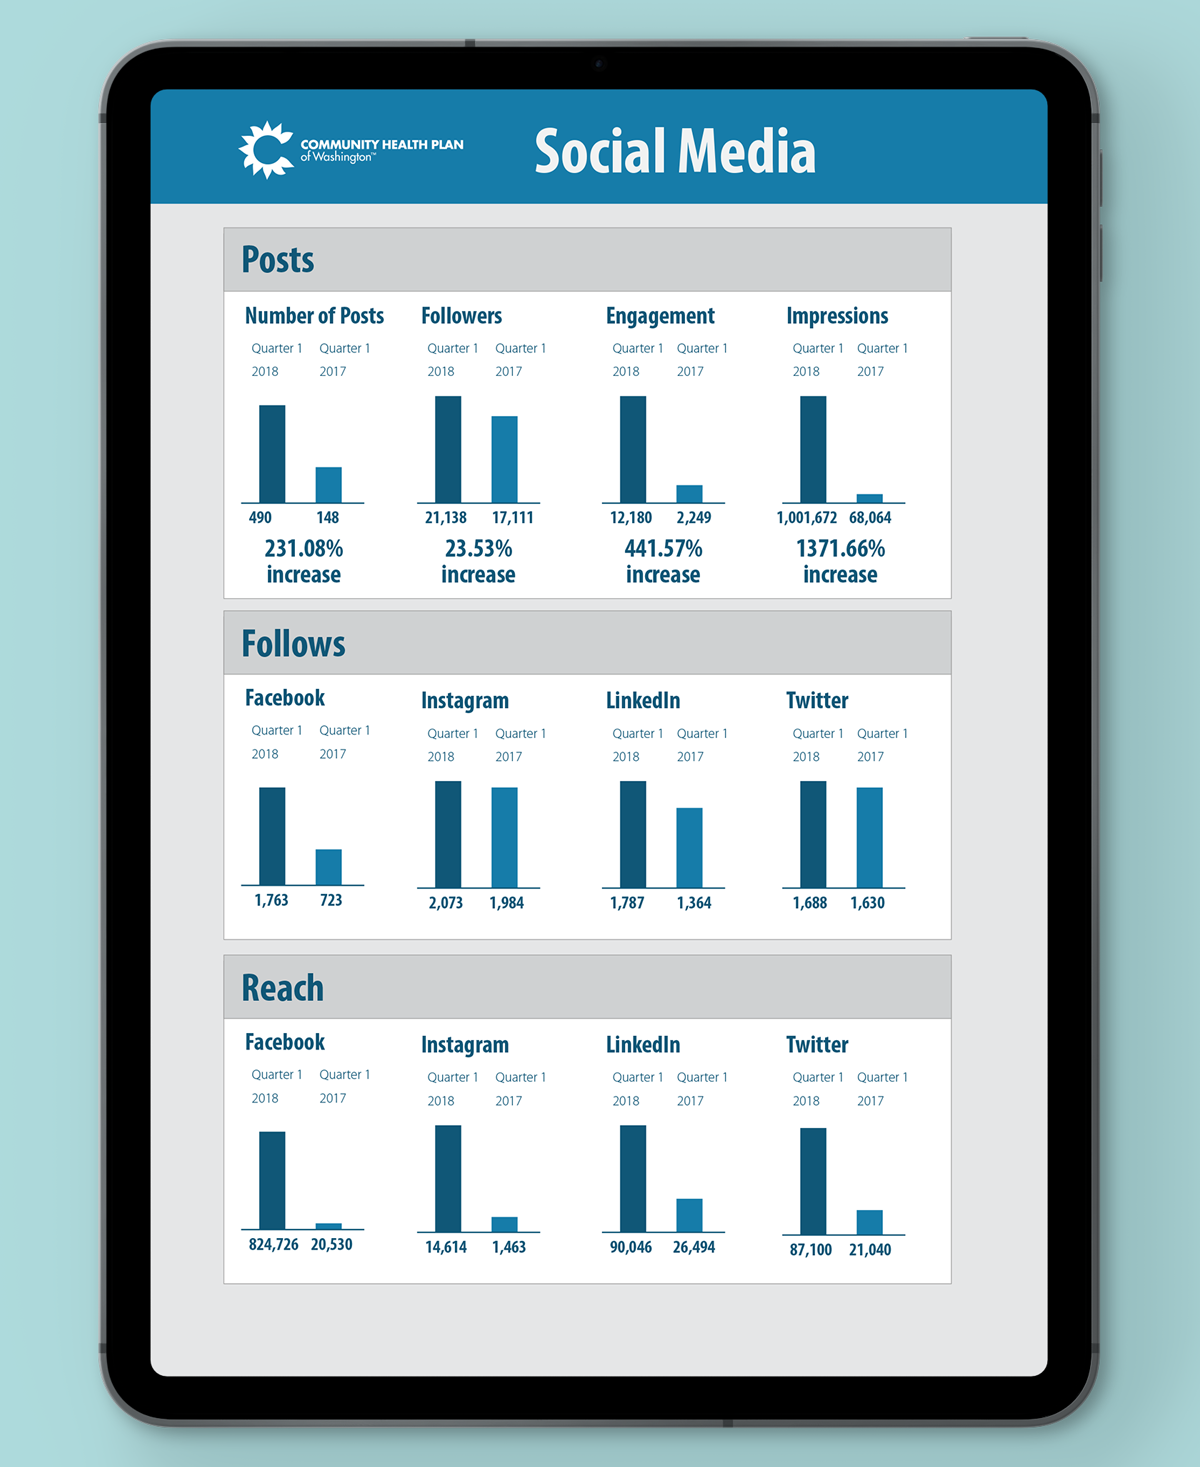
QUARTERLY Social Media Overview
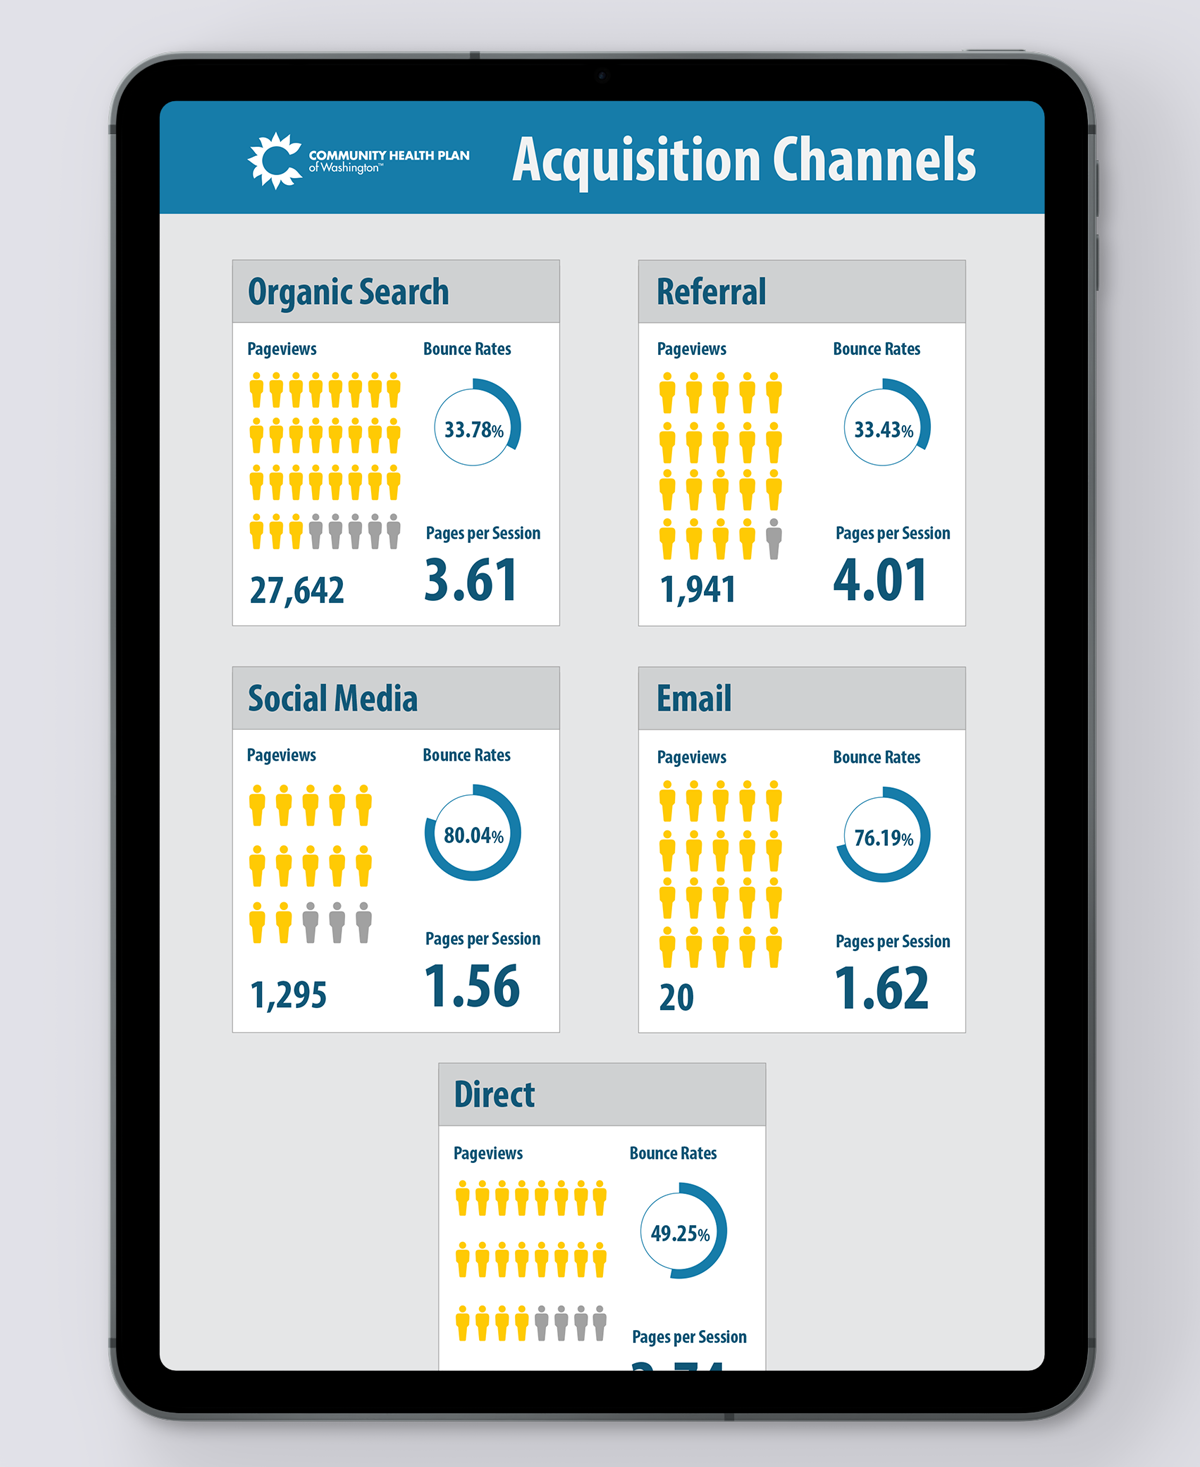
Quarterly ACQUISITION Channel Overview
Client: Community Health Plan of Washington
My Role: Design the original PDF/illustrator file. Take monthly data and turn into an infographic
Platform:
PDF
Tools:
Adobe Illustrator
The CHPW Web Data Visualization Dashboards were created to provide leadership with a high level overview of our web and social media activity. My role was to concept and design the original web dashboard, the social media dashboard, a trend report and a quarterly overview. For this project I also worked to create a more subdued version of CHPW’s original color palette, that would be more appropriate for our leadership team.
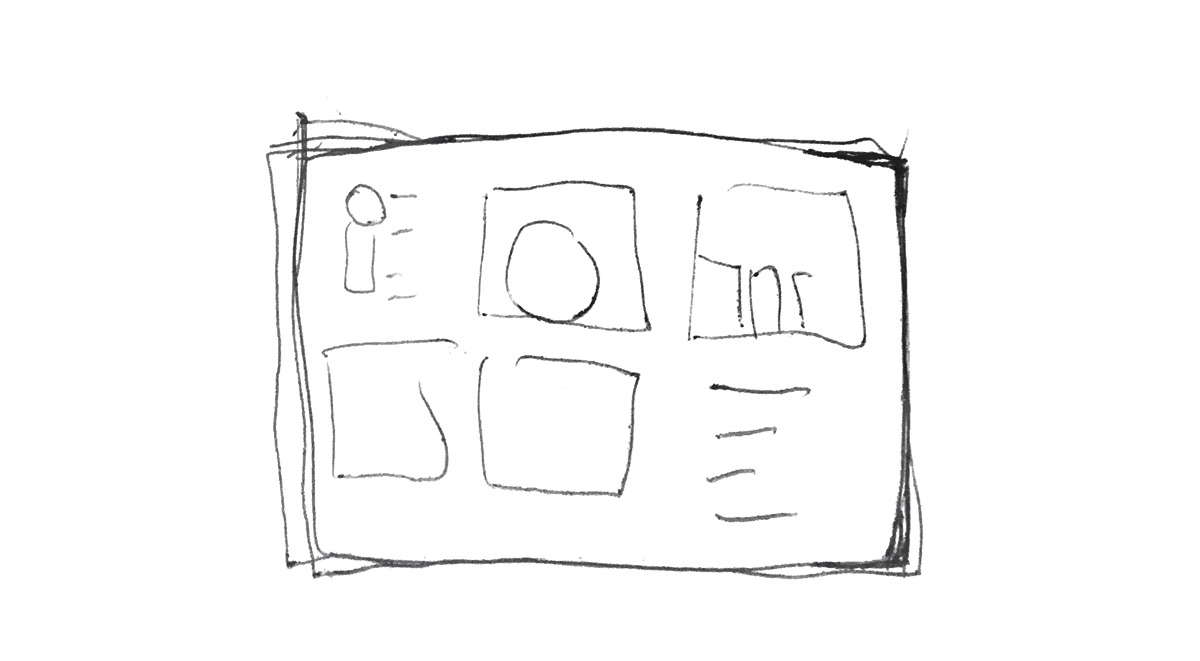
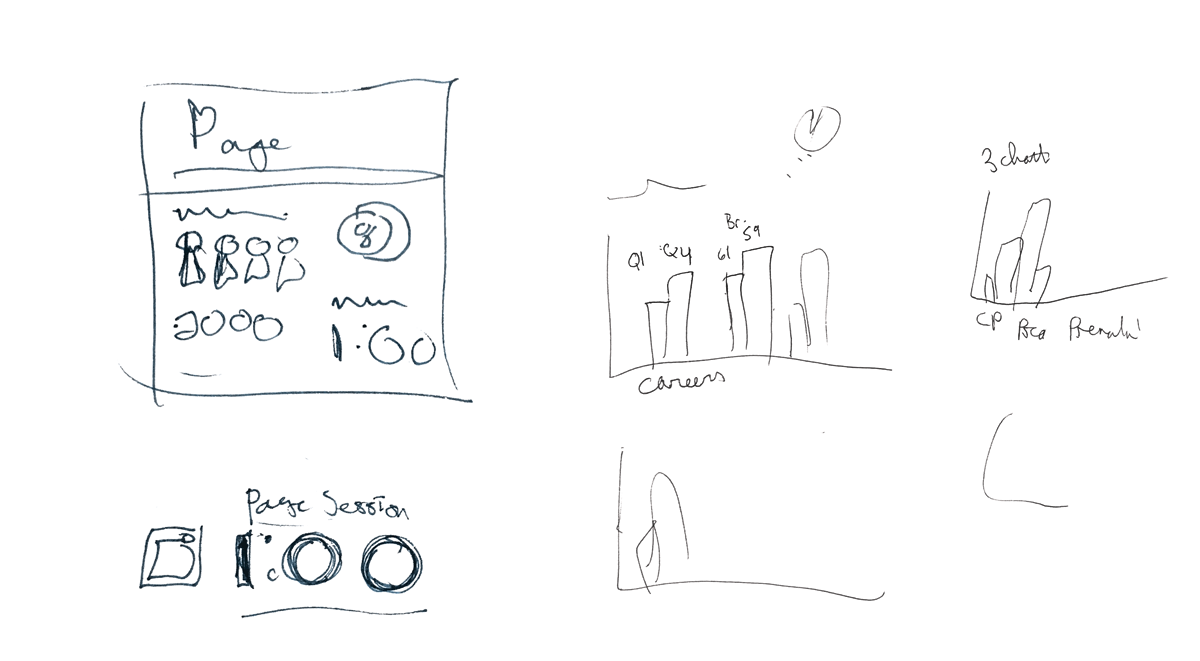
Process Sketches